Very few plants and fungi have been scientifically described – many are destined for extinction before we knew they were extant. Australia’s top companies lack transparency and honesty about their climate politics. Australia’s emissions are decreasing but far too slowly.
Plants and fungi – gone before we knew you
How many species of plants and fungi are there globally? What about in different parts of the world? No one really knows.
The latest knowledge about these questions is summarised in ‘State of the World’s Plants and Fungi. Tackling the Nature Emergency: Evidence, gaps and priorities’ published by the Royal Botanic Gardens, Kew.
It’s impossible for me to summarise the report’s contents so I’ll amuse myself and whet your appetite with a few snippets.
Let’s start with the number of species of vertebrates, plants, fungi and invertebrates:
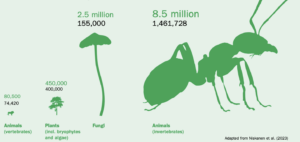
The green number is the total estimated number of species and the black number is the number that have been scientifically described. There seems to be a bit of taxonomic work to do on the fungi and invertebrates.
To know whether a species is at risk of extinction, an assessment needs to be conducted. The percentage of vertebrates, plants, fungi and invertebrates that has been assessed varies greatly:
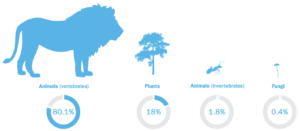
We’re not doing too badly with the vertebrates, not at all well with the plants, and abysmally with the invertebrates and fungi. In fact, assessment risks have been conducted on only one in 5,000 of the fungi that are thought to exist.
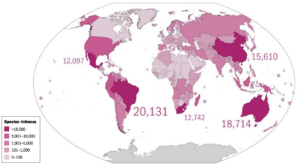
220,000 plant species are unique to a single country, of which 58% have had an extinction risk assessment conducted. Brazil, Australia, China, South Africa and Mexico all have more than 10,000 unique species and collectively account for over a third of country-unique species.
Cycads are non-flowering plants that produce seeds that are not enclosed in fruits (i.e., cones, similar to conifers). They emerged about 350 million years ago in the far north of the planet and spread all over the world’s land. Global cooling over the last 66 million years has reduced the number of species to the current 370 and limited their range to tropical and subtropical areas. Today, 68% of cycad species are at risk of extinction, making them the most threatened order of plants.

Encephalartos woodii, a cycad from South Africa. Now extinct in the wild.
The report concludes that ‘Plants and fungi form the building blocks of our habitable Earth; we lose them at our peril. We have one last chance to save that biodiversity we all depend on. It is imperative that we take action to tackle the current nature crisis, for the simple reason that all life on Earth depends on biodiversity’.
The authors make three broad recommendations:
- Use genomic, geographical, geological and meteorological data and evolutionary history to expand the global effort to understand better what grows where and why and predict how species might respond when new opportunities and pressures arise.
- Conservation efforts should consider not only the number of species in an area but also the diversity and evolutionary history of life forms there. A wider array of traits is likely to provide greater ecosystem resilience to environmental change.
- Fill the historically biased gaps that have arisen within plant description and distribution data and make it easier for everyone to access published research.
Indigenous culture in the trees
Two Saturdays ago, I was at Bush Heritage’s Tarcutta Hills Reserve about 125km west of Canberra. Tarcutta Hills is a 750-hectare property that contains some of the last remaining, critically endangered Grassy White Box Woodlands. It provides habitat for a wide range of threatened birds, reptiles, mammals and plants. The traditional owners of the land are the Wiradjuri people and we were accompanied on the visit by Uncle James Ingram.
Among the many aspects of Wiradjuri life and culture that Uncle James pointed out to us were a boundary tree of the Wiradjuri land (the top photo shows the hole in the tree’s structure formed by two trunks spontaneously grafting together) and the scar formed after the bark was removed from a White Box tree (birri in Wiradjuri language) to make a canoe (muriin).
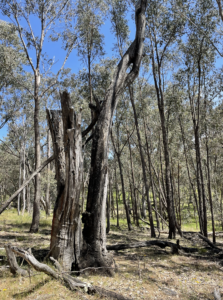
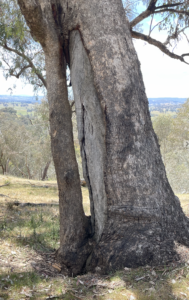
Uncle James gave me permission to take and publish these photos. For those interested in Indigenous languages, there’s a Wiradjuri language app that is available from the usual sources.
Corporate climate lobbying
Well, knock me down with a feather, Australia’s top 50 ASX-listed companies (that includes BHP, Origin, Rio Tinto, Santos and Woodside) have poor governance and disclosure of their political spending and climate lobbying compared with top companies in the USA. In fact, forget the American comparison, the performance of the Australian companies is poor full stop. The majority scored less than 20% on an index of governance, transparency and accountability. Not one scored as high as the USA’s average score.
But wait, there’s another shock: Australian companies have a significant gap between their public pronouncements on climate policy and what they lobby governments to do. Believe or not, they fib!
The one bright note in the report from the Australian Centre for Corporate Responsibility (ACCR) is Chart 3 which shows how the performance of the USA companies improved markedly in just a few years. The number in the top tier of performance increased from 18% in 2015 to 47% in 2022, while the number in the bottom two tiers fell from 49% to 20%.
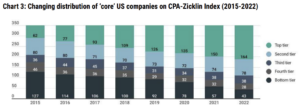
The ACCR recommends that investors use measures of company performance to engage with and pressure executives and board members (especially energy and resource companies) to improve their governance and disclosure of political expenditures and climate lobbying.
Comparing nations’ emissions reductions 1990-2022
Bloomberg Green produced the graph below in a newsletter on 21 September 2023 – I can’t find it online, sorry. It shows the percentage change in greenhouse gas emissions for seven wealthy industrialised nations between 1990 and 2022.
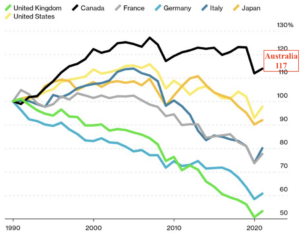
It’s not just the overall changes between 1990 and 2022 that are interesting, so are the different trajectories. UK and Germany stand out as having made the biggest decreases in emissions and having stuck to the task over the whole period. Unfortunately, there’s some winding back of ambition and action in the UK these days.
Regrettably, Australia (which I have added to the graph above) is very much on a par with Canada, having had a 17% increase in emissions over the 32 years.
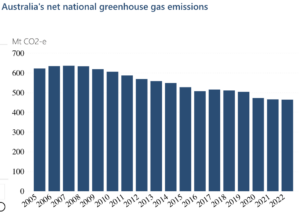
In fairness, Australia’s net emissions (graph above) decreased by 27% between 2007 and 2022 (1.6% per year), although they’ve been in the doldrums since 2016. Our best period was 2007-2016 when emissions decreased by 20% (2.25% per year). In general, our emissions are heading in the right direction but still well below the speed that is required to halt global warming below 1.5oC.
Bill McKibben
Bill McKibben recently compared some of the by-products of petrol- and battery-driven cars:
‘Andrew Nikoforuk writes that “if every electric car owner had to accommodate the waste ore needed for the copper and cobalt in their vehicle’s batteries, the entry to their homes would be shrouded in several tonnes of waste rock”. A ton of rock is roughly the size of a truck tire; it’s big, but still a rock. An internal-combustion engine, however, takes a gallon of gas, which weighs six pounds, to propel an average American car twenty-four miles and, when it burns, the carbon mixes with oxygen atoms in the air to make about twenty pounds of carbon dioxide. The average American vehicle, driven the average American distance, produces its own weight in CO2 annually, and that CO2 is not inert, like rock – it’s up in the air, trapping heat, for a long time. The CO2 that came out of the back of the Plymouth Fury that I drove when I got my learner’s permit in 1976 is still up there in the atmosphere, trapping heat; it’s not “shrouding the entrance to my home”, it’s shrouding the Earth.’
‘Nikoforuk continues, “One barrel of oil (160 l) has the same amount of energy as up to 25,000 hours of hard human labor, which is 12.5 years of work. At $20 per hour, this is $500,000 of labour per barrel.” A barrel of oil costs about seventy dollars in this week’s market price.’
McKibben. The New Yorker. 5 July 2023. ‘To save the planet, should we really be moving slower?’
The advantages of oil aren’t limited to price. There’s also speed and practicality. It doesn’t matter how many strong people you could muster, they’d struggle to power a medium sized family car from Canberra to Brisbane in 14 hours at an average speed of 90km/hour which is what a barrel of oil can do. I’m not defending the use of oil in the 21st century; I’m simply demonstrating that it’s not difficult to see its attraction during the 20th.
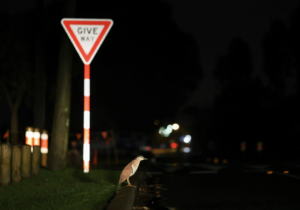
Birdlife photography award finalists
These tweeters are worth paying attention to.

Peter Sainsbury is a retired public health worker with a long interest in social policy, particularly social justice, and now focusing on climate change and environmental sustainability. He is extremely pessimistic about the world avoiding catastrophic global warming.
